DASHBOARD
Purpose: The Dashboard serves as the central landing page and command center for users upon logging in. It provides a comprehensive, real-time overview of system performance, workflow status, team activities, and key metrics, enabling users to quickly access important information, navigate to various modules, and monitor their workload.
Accessing Dashboard
Navigation: Main → Dashboard
This is the landing page displayed after a user logs in.
The dashboard greets the user with their name, an "Overview" label, and the last updated time. It also features a refresh button on the right to manually refresh the data.
Layout Structure
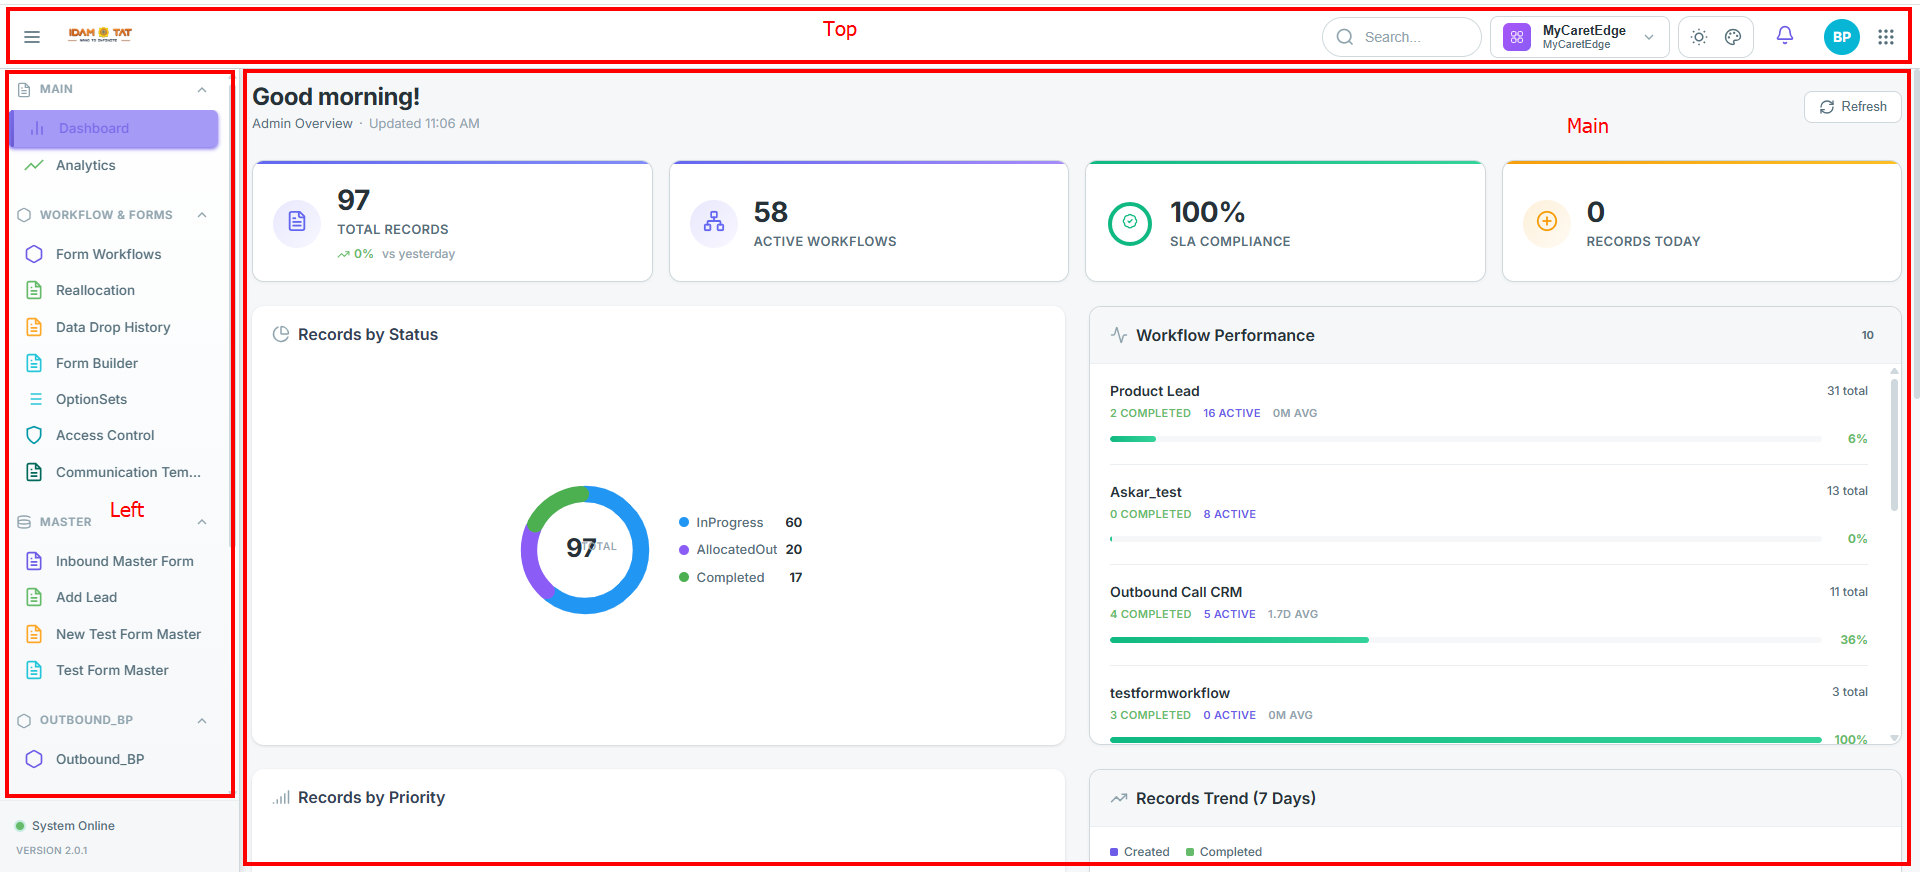
The page is divided into three main zones:
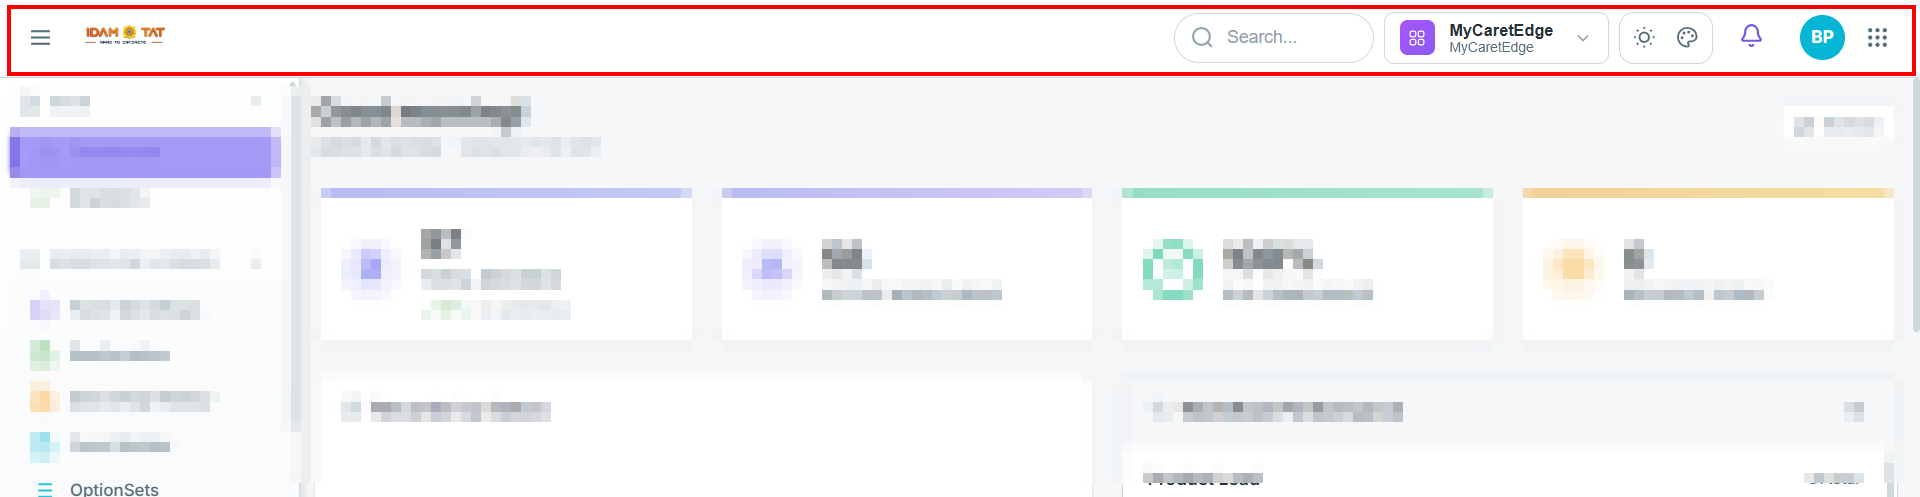
- Top Bar — A full-width header with search, organization switcher, and user controls.
- Left Sidebar — A fixed navigation panel grouped by section.
- Main Content Area — The scrollable dashboard content shown after login.
1. Top Bar
| Element | Description |
|---|---|
| Toggle Sidebar | Collapses or expands the left sidebar |
| Logo | Company logo (top-left) |
| Search | Global search bar (center) |
| Org Switcher | Hierarchy dropdown for switching organization context |
| Theme Picker | Color theme selector icon (palette icon) |
| Notifications | Bell icon for viewing alerts |
| Avatar | User initials (e.g., BP) — opens the user profile menu |
| Switch Application | Switch to another application |
Org Hierarchy (Switcher Dropdown)
Clicking the Organization (e.g., MyCaretEdge) switcher in the top bar opens a panel showing the current selection:
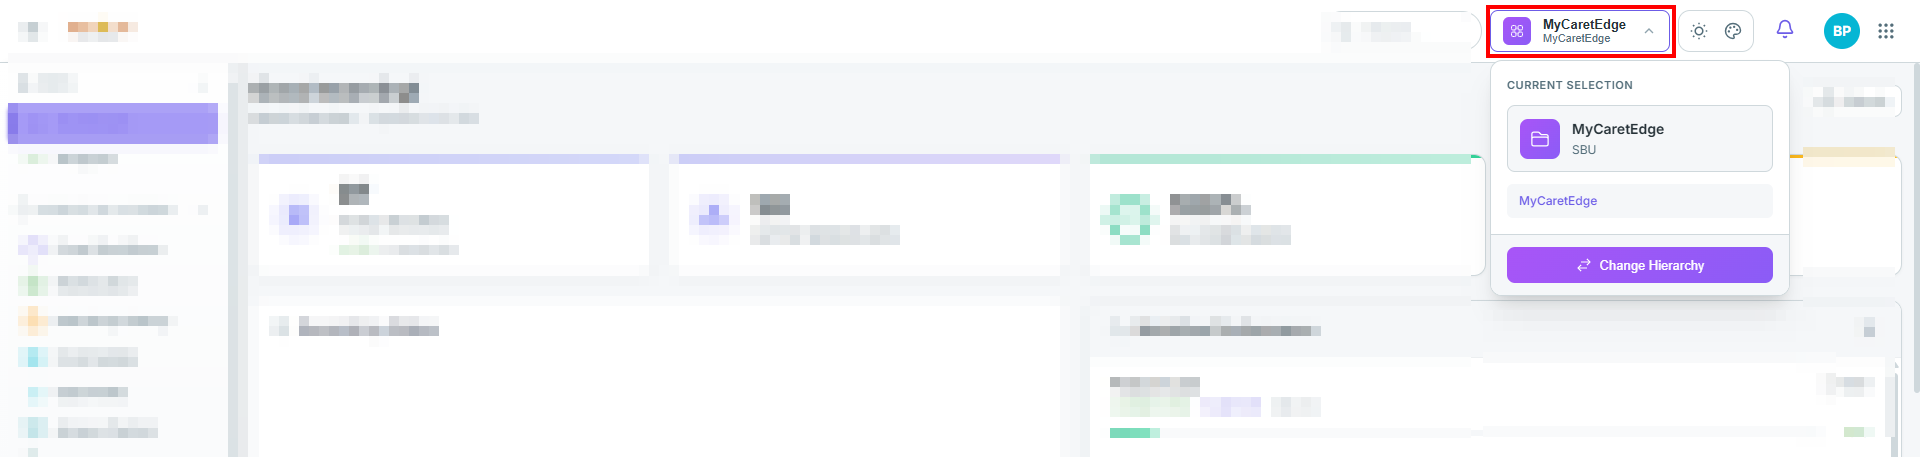
- Organization: MyCaretEdge
- Type: SBU (Strategic Business Unit)
A Change Hierarchy button allows the user to switch to a different organization or SBU context.
Color Themes
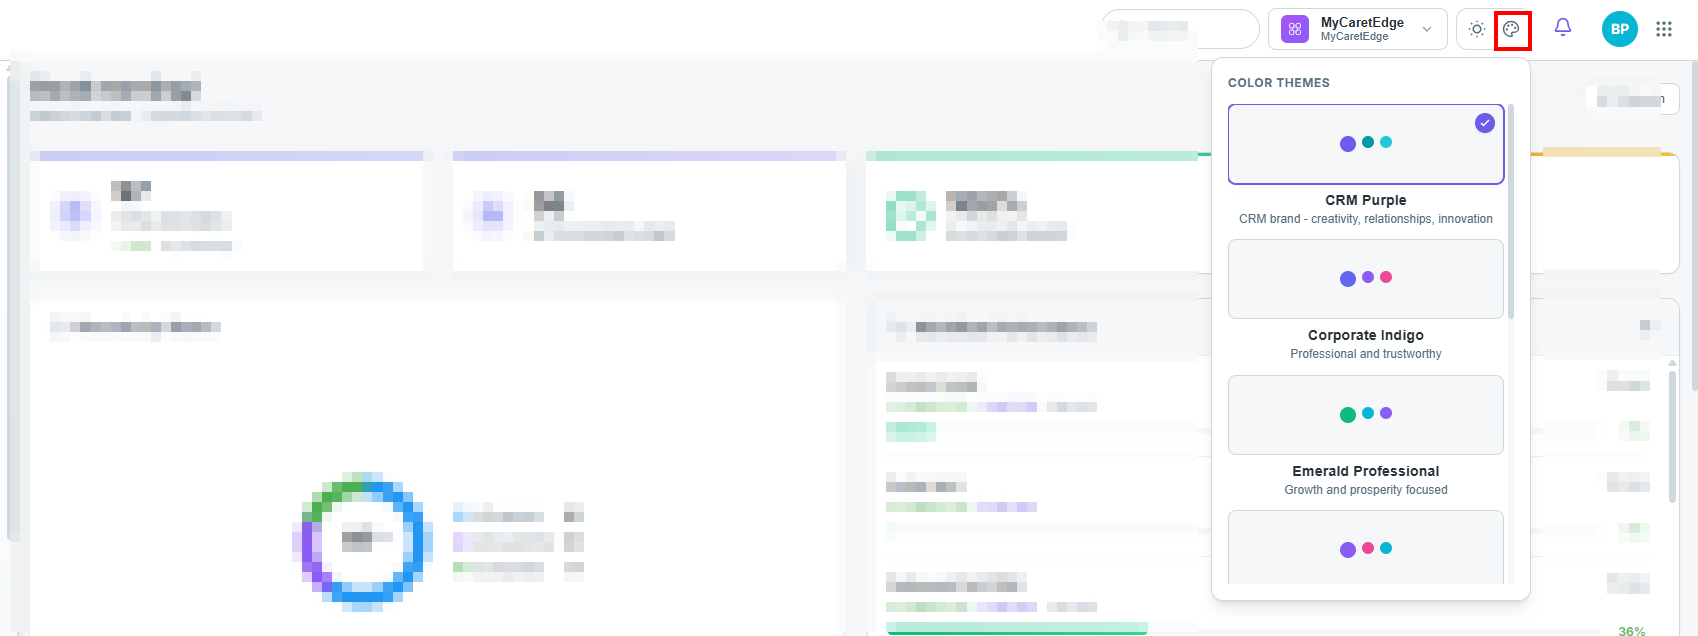
Accessible via the palette icon in the top bar. Users can switch the UI accent color across multiple available themes:
| Theme | Colors | Description |
|---|---|---|
| 🟣 CRM Purple (active) | Purple · Teal · Cyan | CRM brand — creativity, relationships, innovation |
| 🔵 Corporate Indigo | Indigo · Pink · Red | Professional and trustworthy |
| 🟢 Emerald Professional | Green · Teal · Purple | Growth and prosperity focused |
| 🩵 Ocean Breeze | Cyan · Blue · Teal | Calm, clear, and focused |
| 🟠 Sunset Orange | Orange · Coral · Amber | Energetic and bold |
| 🩷 Rose Quartz | Pink · Lavender · Mauve | Soft, elegant, and modern |
| ⬛ Midnight Dark | Charcoal · Steel · Slate | Sleek dark-mode aesthetic |
| 🟡 Golden Horizon | Gold · Amber · Brown | Warm, premium, and confident |
The currently active theme is CRM Purple, indicated by a checkmark. Themes apply instantly across the entire UI without a page reload.
User Profile Menu
Clicking the user avatar opens a dropdown menu with the following items:
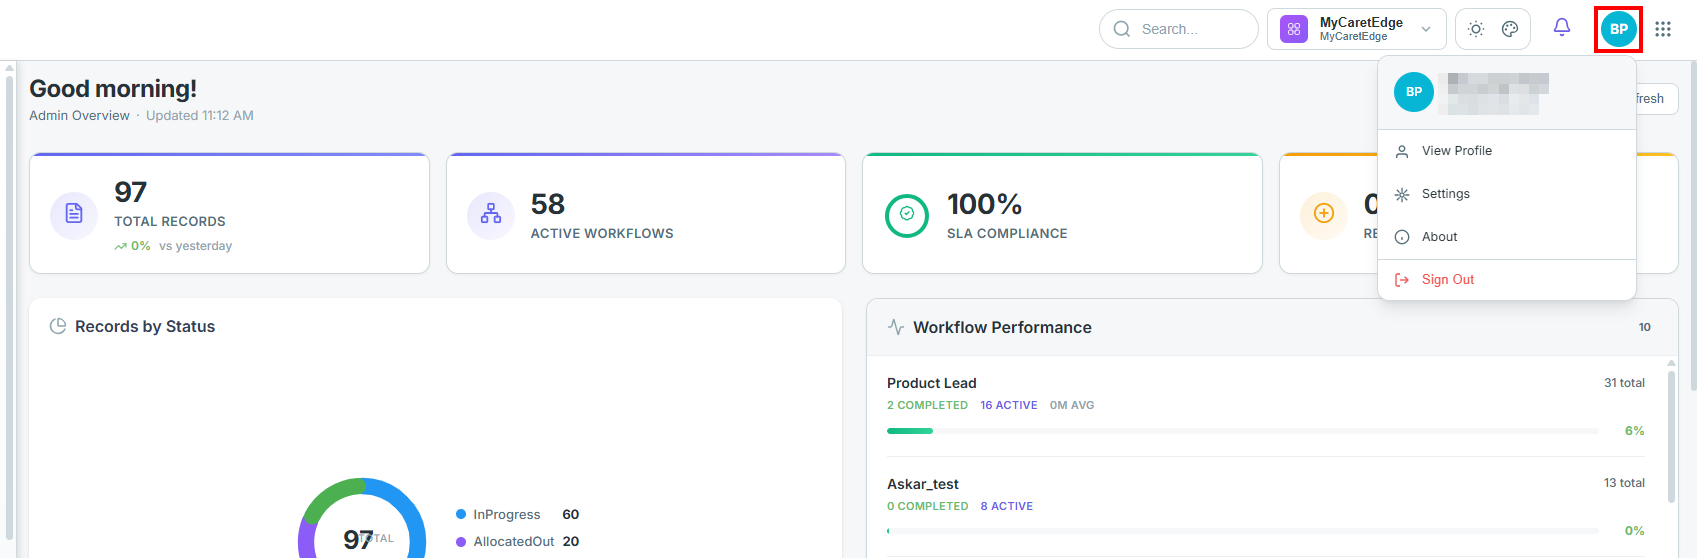
- Display Name: Shows the user's name
- Email Address: Shows the user's email
-
View Profile: Opens the profile modal with personal details
- when the user clicks "View Profile" from the avatar dropdown.
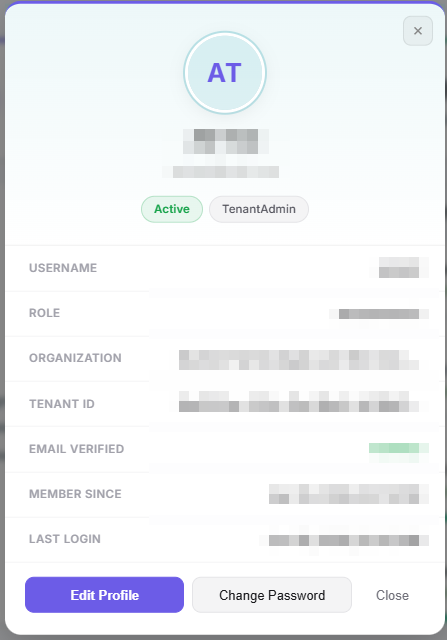
- when the user clicks "View Profile" from the avatar dropdown.
-
Settings: Opens user settings
- About: App info
- Sign Out: Logs the user out (shown in red)
Switch Application
Users can seamlessly switch between different applications within the Advaita ecosystem by clicking the switcher icon — the selected application will open instantly without needing to log in again.
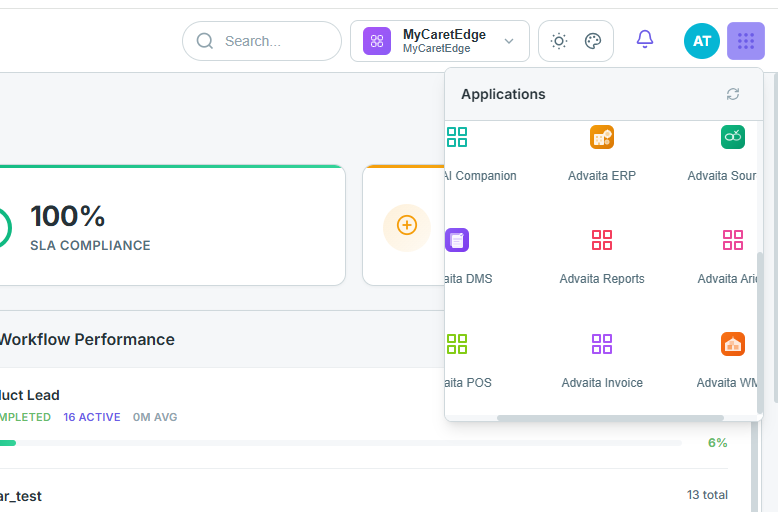
| Application | Description |
|---|---|
| Advaita Workspace | A centralized hub for managing tasks, team collaboration, and day-to-day work activities |
| Advaita One | A unified platform that brings together core business functions into a single, integrated experience |
| Advaita CRM | A Customer Relationship Management system for managing leads, customers, and sales processes |
| Advaita Flow | A workflow automation tool for designing, running, and monitoring business processes and approvals |
| Advaita Data Bridge | A data integration layer that connects, syncs, and transfers data between different systems and sources |
| Advaita BI | A Business Intelligence tool for data analysis, visualization, and reporting |
| Advaita AI Companion | An AI-powered assistant that helps users with smart suggestions, automation, and intelligent decision support |
| Advaita ERP | An Enterprise Resource Planning system for managing finance, inventory, procurement, and operations |
| Advaita Sourcing | A comprehensive procurement platform for managing supplier relationships, purchase orders, and supply chain operations |
| Advaita DMS | A Document Management System for storing, organizing, and retrieving business documents securely |
| Advaita Reports | A reporting and analytics tool for generating insights, dashboards, and data-driven business reports |
| Advaita Arion | A comprehensive platform for managing and optimizing project-based business operations, including project planning, execution, resource management, collaboration, and reporting |
| Advaita POS | A Point of Sale system for managing retail transactions, billing, and sales operations |
| Advaita Invoice | An invoicing tool for creating, sending, and tracking bills and payment records with clients |
| Advaita WMS | A Warehouse Management System for managing inventory, orders, and warehouse operations |
2. Left Sidebar
The Left Sidebar is the primary navigation panel for the CRM platform. It groups related tools and configuration portals into logical categories:
Main
Provides high-level landing pages for day-to-day oversight:
- Dashboard (active) | Displays the real-time operational overview, key performance indicators (KPIs), charts, and activity feeds.
- Analytics | Deep-dive analytics pages containing specialized reports and performance trend graphs.
Workflow & Forms
Tools to design, manage, and audit data-entry forms and their operational pathways:
- Form Workflows | Configure rules, conditional branching, and automatic routing paths for form submissions.
- Reallocation | Batch-reassign records or form submissions from one owner or team member to another.
- Data Drop History | View the audit log and status of bulk data uploads or system data drops.
- Form Builder | The visual workspace to construct and edit user-facing forms, customize fields, and define validation logic.
- Option Sets | Maintain global, reusable lists of options (dropdown menus, radio buttons) utilized across multiple forms.
- Access Control | Define roles, granular access privileges, and security visibility levels for form submissions.
- Comms Templates | Create and manage standardized communication templates (e.g., email, SMS) triggered during workflow stages.
Master
- Masters List | Dynamically populates based on database configuration (e.g., standard dropdown lists, state lists, country catalogs, or supplier directories). Refer to the Master Data Guide for more details.
Stages
- Stages List (Dynamic) | Automatically updates depending on the selected workflow context, representing the sequential progression stages (e.g., Draft, Under Review, Approved) of records in that workflow.
Reports & Analytics
Generate and retrieve custom views and exports of system activity:
- Reports | Access tabular data views, query builders, and pre-formatted reports.
- Dashboards | Create, view, and customize multiple visual dashboard widgets.
- Export Center | Retrieve and download bulk files (e.g., Excel/CSV) generated by system export requests.
System
Global backend configuration and integration settings:
- Extensions | Install, toggle, or configure third-party plugin integrations.
- Dialer Settings | Setup telephony integrations, call routing, and interactive voice response (IVR) settings.
- System Health | Monitor server statuses, database performance, and operational uptime diagnostics.
- Audit Logs | A comprehensive security audit trail recording user and API action histories.
- Notifications | View user-centric alerts and messages.
- Notification Rules | Set up conditions under which automated alerts (emails, push notifications) are dispatched.
- API Keys | Issue and revoke external access tokens for integration purposes.
3. Dashboard (Main Content Area)
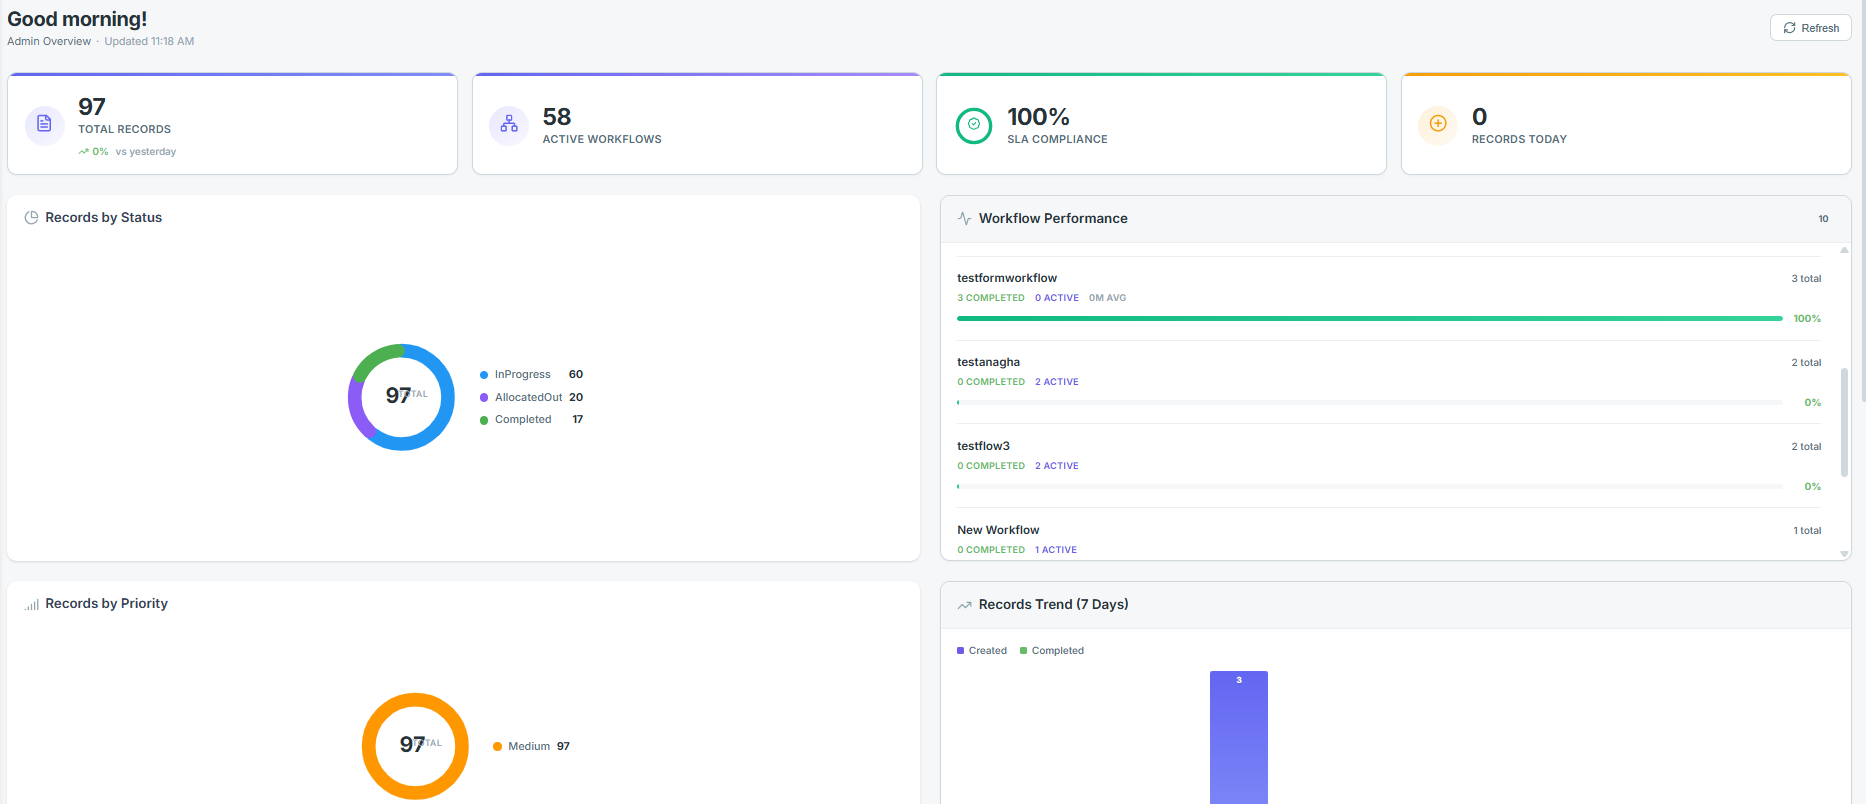
The main content area provides a comprehensive view of system performance, workflow status, and recent team activities through various widgets and charts.
KPI Cards
Located at the top, these cards provide quick, high-level metrics:
- Total Records: Shows the overall volume of records (e.g., 97) and a trend indicator compared to the previous day (e.g., ↑ 3.2%).
- Active Workflows: The total number of workflows currently active (e.g., 58).
- SLA Compliance: Percentage of service level agreements being met (e.g., 100%).
- Records Today: Number of new records created today (e.g., 3).
Analytics & Charts
- Records by Status: A donut chart breaking down the total records by their current state (e.g.,
InProgress,AllocatedOut,Completed). - Workflow Performance: Horizontal bar charts visualizing the completion rate of individual workflows. It displays total records, completed vs. active counts, average time taken, and an overall percentage completion.
- Records by Priority: A donut chart segmenting records by urgency (e.g., showing how many are
Mediumpriority). - Records Trend (7 Days): A daily bar chart comparing the volume of records Created versus records Completed over the past week, helping identify peak activity days.
Team & Activity Monitoring
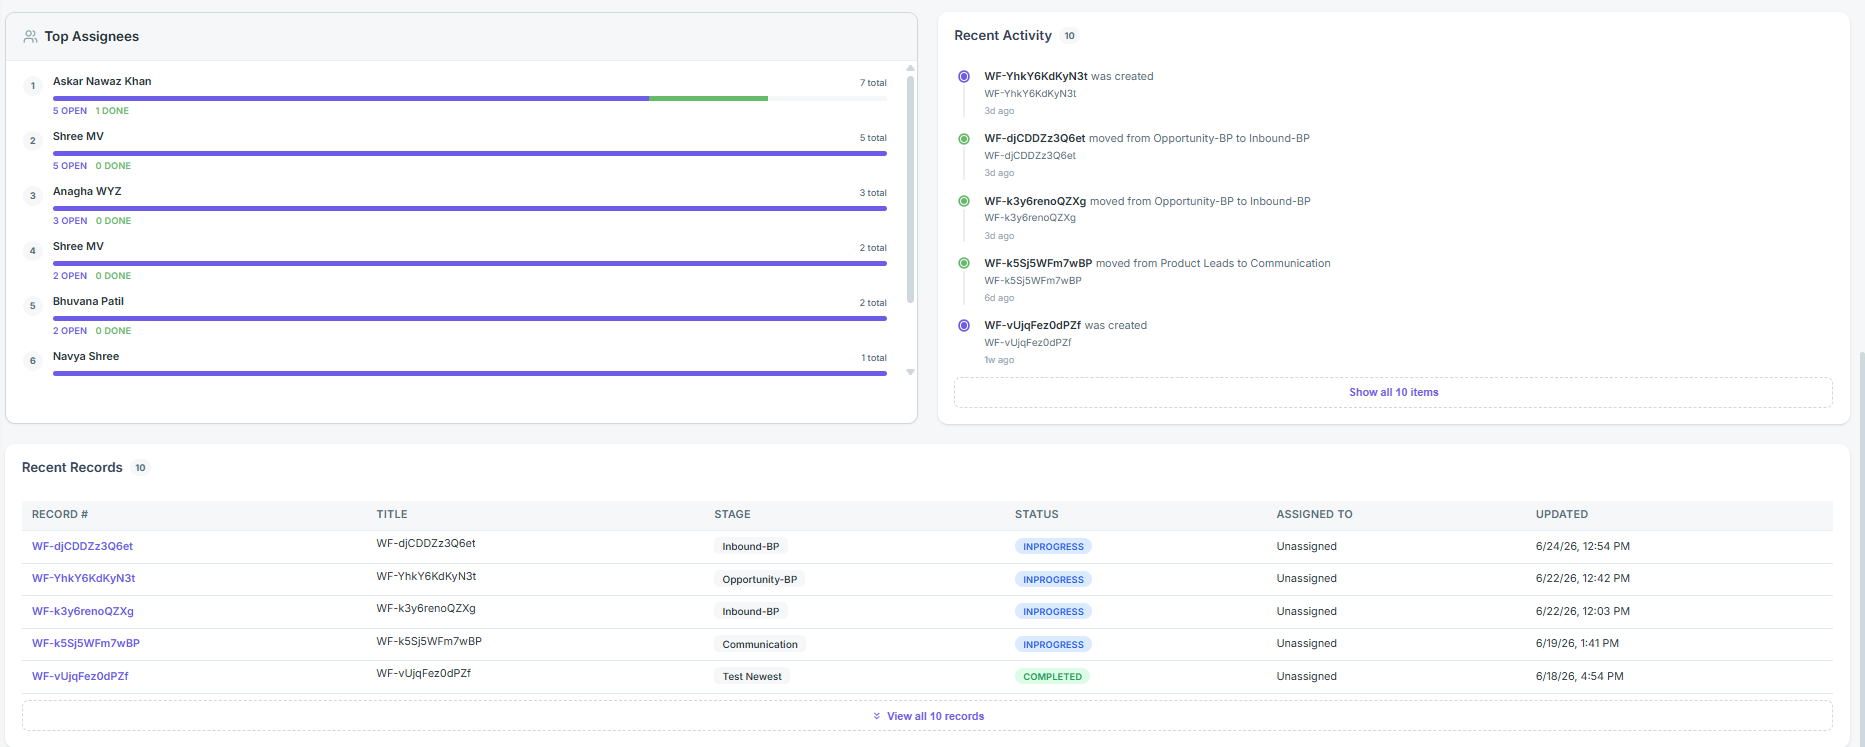
- Top Assignees: Ranks team members based on the number of records assigned to them. It provides a visual bar showing their total workload, broken down into open vs. done tasks.
- Recent Activity: A real-time timeline feed showing system events, such as when a record is created or moved between stages (e.g., "moved from Opportunity-BP to Inbound-BP").
- Recent Records: A detailed data table listing the latest records in the system. Columns include:
- RECORD #: Clickable identifier for the record.
- TITLE: Name of the workflow or record.
- STAGE: The current phase the record is in.
- STATUS: E.g.,
INPROGRESS,COMPLETED. - ASSIGNED TO: The user handling the record.
- UPDATED: Timestamp of the last modification.
Frequently Asked Questions (FAQ)
Q 1. What is the main purpose of the Dashboard?
A: The Dashboard serves as the central command center for users after logging in, providing a real-time, comprehensive overview of system performance, workflow status, team activities, and key metrics.
Q 2. How do I change the user interface color theme?
A: Click the palette icon (Theme Picker) in the Top Bar to open the color theme selector. You can choose from multiple themes (such as CRM Purple, Corporate Indigo, Ocean Breeze, or Midnight Dark). The chosen theme applies instantly across the entire UI without requiring a page reload.
Q 3. How do I switch to a different organization context?
A: Click the Organization switcher dropdown in the Top Bar (which displays the current organization, e.g., MyCaretEdge, and its context type, e.g., SBU) and select the Change Hierarchy button to switch contexts.
Q 4. How can I switch to another application in the ecosystem?
A: Click the application switcher icon in the Top Bar. This allows you to switch seamlessly to other platforms (such as Advaita Workspace, Advaita CRM, Advaita Flow, or Advaita AI Companion) instantly, without needing to log in again.
Q 5. What metrics are shown in the KPI Cards at the top?
A: The KPI cards display quick, high-level metrics: - Total Records: Overall volume of records and a trend indicator compared to the previous day. - Active Workflows: Total number of currently active workflows. - SLA Compliance: Percentage of service level agreements being met. - Records Today: Number of new records created today.
Q 6. What information is displayed in the Recent Records table?
A: The Recent Records table lists the latest records in the system and displays:
- RECORD #: Clickable identifier for the record.
- TITLE: Name of the workflow or record.
- STAGE: The current phase/stage of the record.
- STATUS: The current state (e.g., INPROGRESS, COMPLETED).
- ASSIGNED TO: The user handling the record.
- UPDATED: Timestamp of the last modification.